This page is not compatible with Internet Explorer.
For security reasons, we recommend that you use an up-to-date browser, such as Microsoft Edge, Google Chrome, Safari, or Mozilla Firefox.
Fuel Your Statistics with CT Data
Comprehensive Data + Reliable Statistics
= Better Product Quality
Ensuring the best possible product quality with minimized process downtimes and optimized production costs is what every quality and production engineer is aiming for. Hexagon enables just that by combining the comprehensive data acquisition capabilities of industrial computed tomography (CT) with reliable statistical abilities: Volume Graphics VGSTUDIO MAX and VGinLINE in combination with Q-DAS qs-STAT provide quality engineers insights they can use to make decisions that improve product quality.
Drawing actionable insights from large data sets coming from different sources makes fully automated software solutions for secure and traceable data storage and statistical analyses indispensable. However, common office software packages for data analysis or generic reporting software solutions do not provide statistical guidance on how to assess the quality and stability of a process, nor do they fulfill the validation requirements for quality management audits.
VGSTUDIO MAX or VGinLINE for the quality inspection of individual CT datasets and qs-STAT from Q-DAS for the statistical analyses of the inspection results packages can be combined within a seamless semi-automated workflow from scan to statistical analysis in the quality lab, or within a fully automated inspection workflow on the shop floor. This combination provides superior statistical process control based on trusted results of CT-based quality inspection.
Watch Our Videos
In four free videos, experts from Volume Graphics and Q-DAS will introduce you to the world of CT-based quality assurance and its statistical evaluation:
CT in the NDT Landscape
This video showcases the comprehensive data acquisition capabilities of industrial CT and CT data analysis with Volume Graphics VGSTUDIO MAX and VGinLINE. It's perfect for those who are new to the world of non-destructive testing and industrial CT, as well as for experienced users who want to learn about current trends and new areas of application for CT and Volume Graphics software in their daily work.
Q-DAS - Smart Quality Assessment
This video showcases the reliable statistical abilities of Q-DAS qs-STAT. It's perfect for those who are new to the world statistical analyses in general or Q-DAS qs-STAT, as well as for users who want to learn about how to integrate the statistical analysis of inspection results in their daily work.
Statistics Fueled by CT
This video showcases the benefits of fueling your statistics with CT data. Learn how the combination of Volume Graphics VGSTUDIO MAX and VGinLINE with Q-DAS qs-STAT will provide you with insights you can use to make decisions that improve your product quality. See how handing over measurement information from Volume Graphics to Q-DAS software makes it possible to use this information for reports, protocols, or even statistical analysis.
Automated Quality Assurance with CT
This video showcases the automation of CT-based inspection workflows. Learn how VGSTUDIO MAX and VGinLINE can be used to semi and fully automate inspection workflows from scan to statistical analysis.
You Have Questions? We Will Gladly Get in Touch with You!
Do you have questions or need more information about Volume Graphics and/or Q-DAS software? Then simply fill out the form and we will contact you.
Contact Form
Why CT?
CT, a relatively new method for the quality inspection of industrial parts, has become a staple of many quality laboratories and inspection processes. Using an X-ray source to create 2D projections of a part from many different angles—which can then be reconstructed into a full 3D data set—it is well suited for capturing not only the outer surface of an object, but also inner geometries, material structures, and defects (e.g., pores).
This makes CT uniquely suitable as a basis for comprehensive inspections that both include dimensional metrology known from coordinate measurement machines or optical scanners and incorporate NDT methods, such as porosity analyses, wall thickness analyses, or calculating deviations from reference geometries on the inside of a part.
CT is also following the trend towards inline and/or near-line inspection: Advances in CT system technology—such as more powerful X-ray sources and faster, more sensitive detectors—have steadily reduced the amount of time necessary to acquire data of sufficient quality for analysis. With automatic handling and loading systems, it is often possible to scan a large number of parts per day.
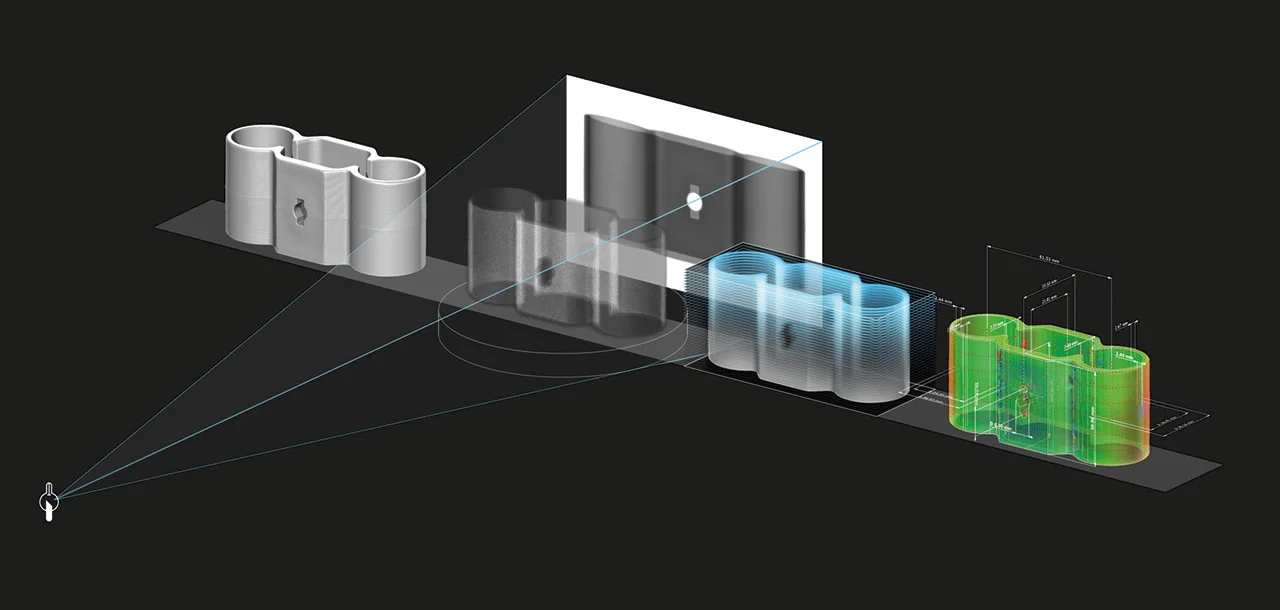
Computed tomography (CT) is uniquely suitable as a basis for comprehensive inspections
Statistical Analysis of CT Inspection Results
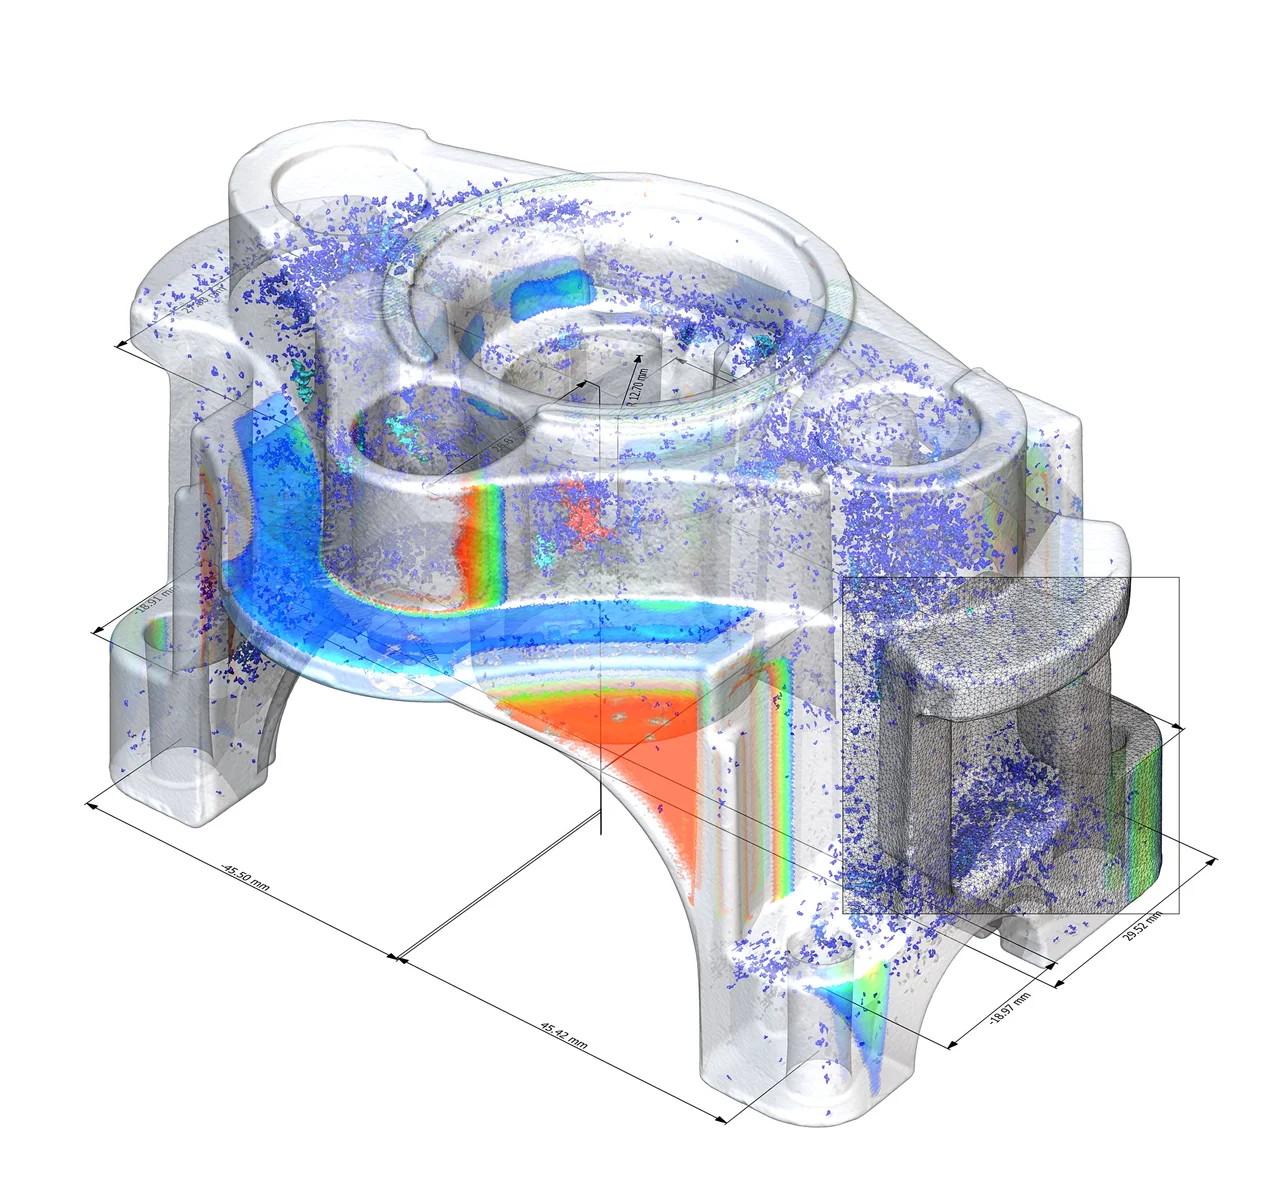
CT not only captures the outer surface of an object, but also inner geometries, material structures, and defects (e.g., pores)
Regardless of the inspection approach you select, CT will allow you to derive a wealth of data from your parts in a short amount of time. This data can not only be used to determine the quality of the individual part, but also holds great potential for insight into the behavior of the part-producing machine—and on a higher level into the entire production process itself. The tool required to achieve this potential is the statistical analysis of inspection results and their associated meta data, such as cavity number and production time.
CT-based metrology works on the determined surface of the scanned part and delivers the same type of results as other dimensional measurement methods, i.e., geometric dimensions and evaluations of shape and position tolerances. Statistical analysis of quality-relevant features, like the positions or straightness of a connector pin, or the diameter of a clearance hole, can be used during machine and process qualification to accurately predict whether parts of sufficient quality can be consistently produced using the selected method and parameters. And once production has been initiated, statistical trends in the same inspection results can be used to detect issues that may occur over time, such as tool wear or the accumulation of form coating in casting, so that mitigations can be implemented before part quality is actually affected.
Hexagon’s Solution
Hexagon’s solution for the qualification and statistical analysis of CT-based quality inspection processes is the combination of the following software packages:
- VGSTUDIO MAX or VGinLINE from Volume Graphics for the quality inspection of individual CT data sets and
- Q-DAS qs-STAT from Q-DAS for the statistical analysis of the inspection results
Both software packages are leading products in their respective fields. In the quality lab, they can be combined into a semi-automated workflow in which CT scans of multiple parts are automatically analyzed in batches in VGSTUDIO MAX and the results are then manually imported into qs-STAT for process qualification or statistical analysis.

For inline inspections in production, a fully automated inspection and analysis workflow can be achieved using VGinLINE, which automatically analyzes each new CT data set as it is generated by a CT scanner on the shop floor, followed by an automated import of the inspection results with Q-DAS Q-DM (Quality Data Management) and subsequent statistical analysis in qs-STAT.
From design to serial production, VGSTUDIO MAX enables you to keep the quality high by getting full insight into your products. At every step of the production process. All over the world.
The demands on the quality of your products are numerous and challenging. The tools in VGSTUDIO MAX provide you with the reliable results you need to make the right decisions to meet these demands. Whether you are using the all-encompassing technology of CT or other 3D data formats such as point cloud, mesh, and CAD; VGSTUDIO MAX covers all your requirements related to metrology, defect detection and assessment, material properties, or simulations in a single software. All of its analysis, simulation, and visualization tools fit perfectly into your digital workflow.
Obtain results quickly, easily—and with incredible accuracy. The metrology algorithms are tested by the national institutes PTB and NIST. Furthermore, VGSTUDIO MAX can determine the surfaces of your scanned objects, including the smallest details, with subvoxel accuracy.
VGinLINE inspects your parts automatically and non-destructively with industrial computed tomography (CT). It’s simple to set up and works with almost every CT system on the market – right out of the box.
VGinLINE automatically or semi-automatically inspects your parts with a recurring analysis pattern:
- Fully automated, in-line: 100% inspection in industrial production
- Fully or semi-automated, at-line: small batch series inspection in industrial production or quality labs
- Semi-automated: sample tests in quality labs or at service providers
VGinLINE Complete offers all relevant features of VGSTUDIO MAX, i.e., coordinate measurement, wall thickness analysis, nominal/actual comparison, defect detection (pores, voids, inclusions), fiber orientation analysis, and foam/powder analysis.*
You can easily reconfigure VGinLINE yourself, whether you need to adjust for small changes to the product design or want to inspect a totally different product. Individually developed inspection systems are often geared to just one task, typically making changes difficult and very expensive to implement.

Reliable Statistics
The evaluations required in machine and process qualification are based on integrated standards and company guidelines (e.g. BMW, GMPT, Robert Bosch, Volkswagen etc.). There are numerous statistical procedures available identifying the best suitable distribution time model automatically and assigning the data to the respective process model as given in ISO 21747. Using standardized evaluations provides safety and guarantees the reproducibility of results.
In order not to lose track of the wide variety of results and values, it is important to use suitable graphics, charts and tables. Clearly understandable and significant graphics illustrate the calculated statistics and this kind of visual support makes it easy for users to identify critical processes quickly. qs-STAT always focuses on clarity to direct the users’ attention immediately to weak points and deviations. Summary graphics are an essential tool for the definition of corrective actions to optimize the process. Different filters and selection functions help provide you with exactly those pieces of information you need.
Recording measurement and test data in SAP/R3 QM, qs-STAT is able to evaluate these data in the background. The resulting statistics, graphics and reports are displayed directly in SAP. Users are thus able to combine the advantages of Q-DAS statistics with the application of SAP.
Standards for Quality Management concretely require a confirmation for the eligibility of the applied soft-ware for the intended application, before initial use as well as for a continuous use.
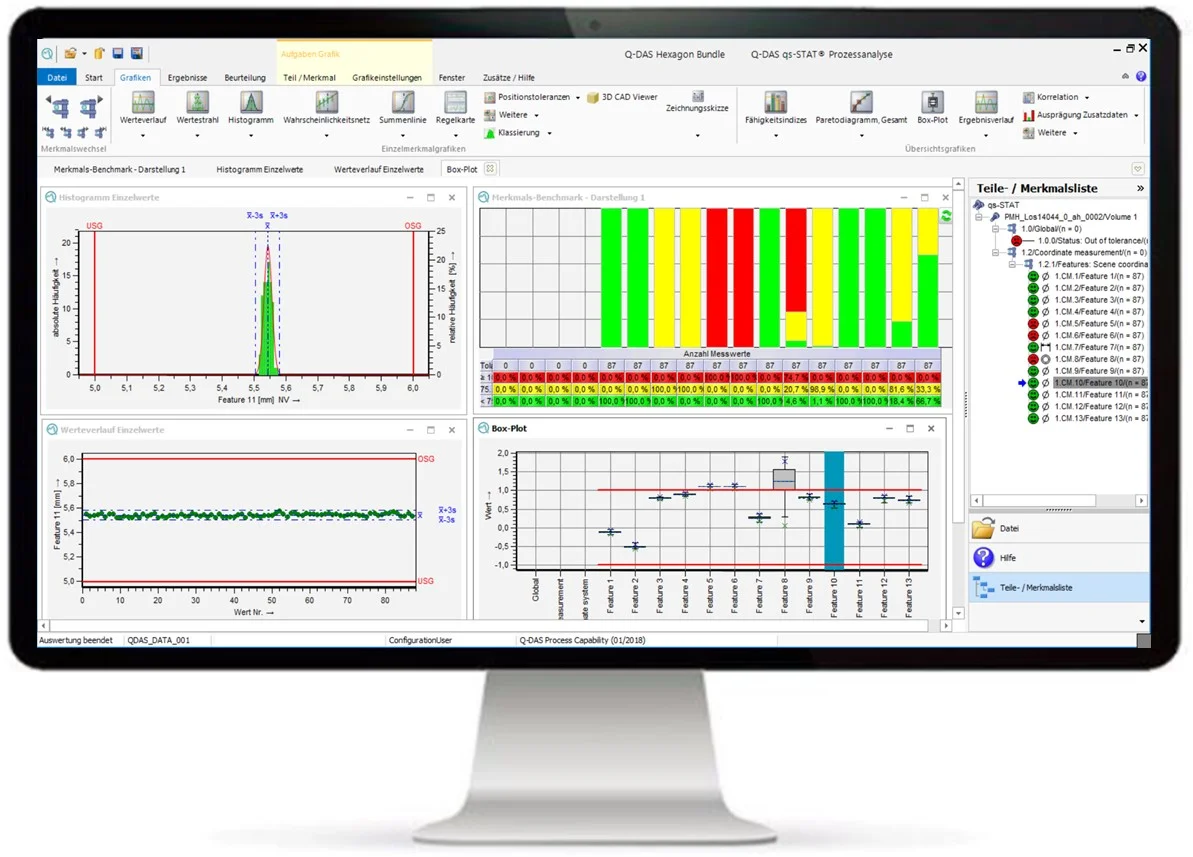
With ongoing re-qualification in Q-DAS qs-STAT, you ensure stable processes
Q-DAS Solutions for the Connected Factory
The Q-DAS solution is a scalable solution. It can start with a simple solution (1:1 connection of inspection equipment and Q-DAS qs-STAT) and be continuously expanded. Due to the established Q-DAS ASCII transfer format, the integration of further inspection and test equipment (automated or handheld) is possible without investing any great effort into it. Automated reporting and notification functions allow integration into a complete solution, either per company location or across multiple company locations.
Setting up an Inspection Plan

Setting up an automated inspection in VGSTUDIO MAX
Inspections of your CT data can be set up using VGSTUDIO MAX, where individual scans of your parts can be visualized and examined. You can use GD&T to measure relevant features just like you would on a CMM. The extraction of an actual part geometry from a CT scan in VGSTUDIO MAX (known as “surface determination”) is a leading reference in the CT world, and its accuracy has been validated in several scientific studies. Furthermore, the algorithms for fitting reference geometries to an object’s surface in VGSTUDIO MAX and VGinLINE have been verified by both PTB and NIST.
Automated Inspection and Data Transfer
Once defined, inspection plans can be applied to other scans of similar parts in an automated way. The automation capabilities of VGSTUDIO MAX can be easily used to inspect batches of scans, and inline inspections of an ongoing production process can be achieved using the VGinLINE automation system. Regardless of whether you are running semi- or fully automated inspections, inspection plans can be connected to your Q-DAS statistical analysis software. All available GD&T features can be exported in the Q-DAS ASCII transfer format. And all these exported results can be combined with customizable views of the assumed inspection results, which can be used to display easy-to-digest reports directly in Q-DAS qs-STAT.
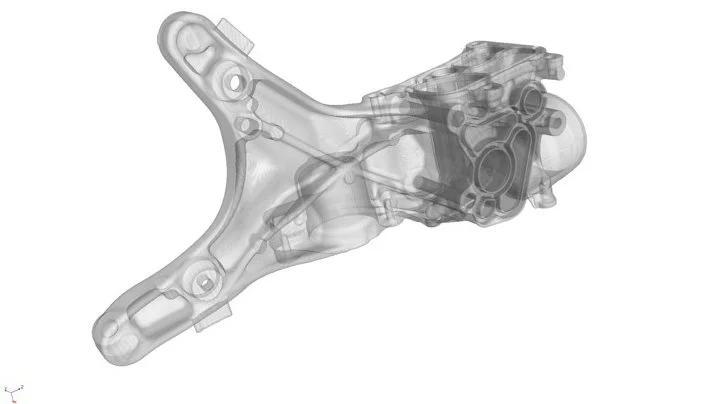
Exported view of a scanned part for use in Q-DAS qs-STAT report display
Process Qualification and Statistical Analysis with Q-DAS qs-STAT
Q-DAS qs-STAT is a software package designed to statistically evaluate production-relevant quality information and to assess systems and processes. Significant and well-established statistical evaluations provide the basis for assessing and continuously improving processes in industrial production. Furthermore, the standards and guidelines included in the software provide the necessary basis for the interpretation of the results.
qs-STAT offers the right toolset for quality and production engineers at every stage of production, including
- machine qualification,
- process qualification, and
- statistical process analysis
Machine Qualification
Before production starts, production machines need to be set up. qs-STAT offers support through a wide range of tools and analyses and documents this ramp-up process.
A machine capability analysis is used to determine whether a machine is capable of producing parts so that the quality parameters (e.g., the dimensions of the measured features) are well within the tolerance limits in a stable manner. For this purpose, a sample of approximately up to 20 parts produced on one machine in one sequence without variations in tools, operators, materials, machine parameters, or ambient conditions is examined. For more expensive parts, it may be more efficient to perform pre-run studies with a lower number of parts beforehand to obtain an initial overview.
For each measured feature, the time series of measured values can be analyzed both visually and with statistical tests for undesired outliers or non-random trends. Variations in measured values with respect to the range of the tolerance band and the position of the measured values within the tolerance band is described by the potential and critical machine capability indices, Cm and Cmk. Cm and Cmk values are statistical capability measures, i.e., they describe whether a production machine is capable of producing parts in the quality required. In order to locate potential problems—such as a possible need for a final tool or milling path correction—it can be helpful to show the location of the measured features as well as the time series of their measured values in an overview image of the component, which can be exported from VGSTUDIO MAX and imported into qs-STAT using the Q-DAS ASCII data transfer format.
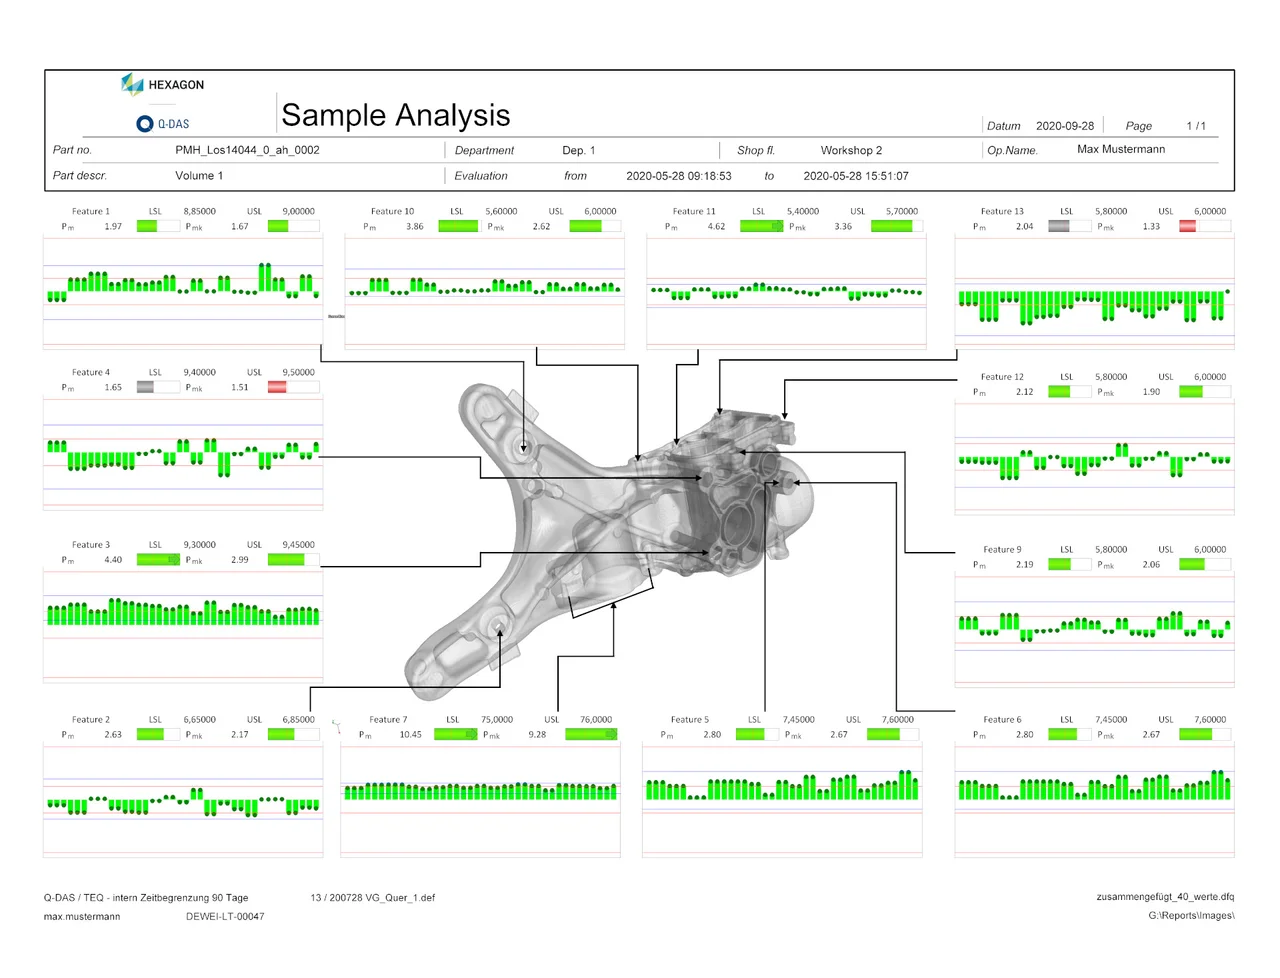
Overview image of a component with time series of measured dimensions
Process Qualification

Process qualification results for a single-part type

Process qualification results for multiple-part types in one summary view
A pre-production process normally leads to a complete process capability study to evaluate the influence of all kinds of variables such as materials, machine parameters, operators or ambient conditions on the production process.
Based on the sample inspection, statistical measures are calculated to qualify the process. The results of an approved process capability study determine the warning and control limits on the basis of which a process control can be installed according to the statistical process control (SPC) approach. It does that in combination with other factors (e.g., the evaluation strategy), which is similar to a decision tree and can be used to determine both the best suitable distribution model and the most suitable Quality Control Chart (QCC).
The above method has two advantages over a 100% measurement and/or quality control based on a defined tolerance. First, the number of measurements to be taken will be reduced significantly, and second, statistical control via the control limits. A control limit violation may take place long before a tolerance limit is reached. The action can therefore be taken much earlier at a stage in which all produced products still are in top quality conditions.
Evaluation strategies are either based on standards, association and corporate guidelines (e.g., BMW, GMPT, Robert Bosch, or Volkswagen), or an individual approach. The selected evaluation strategy is included and used automatically, which leads to comparable and reliable results comparable. Aside from the pre-installed evaluation strategies based on standards and association and corporate guidelines, qs-STAT also offers the possibility of creating customer-specific strategies—for instance, to make results comparable across all products within the company. Thus, Q-DAS qs-STAT, as all Q-DAS software, is fully able to be validated according to the given standards.
Statistical Process Analysis
Once the pre-production phase has been successfully completed, series production starts. To ensure a stable and reliable process within the required Cp and Cpk values, continuous requalification needs to take place, as even an assessed process may change over the time.
Whenever a process no longer meets its expected Cp or Cpk value, a deeper root-cause analysis may be required to determine the reasons behind deviations. qs-STAT supports quality engineers with a rich set of analysis options for determining root causes or correlations and uncovering dependencies that might not have been seen during the process capability study.
Besides standard supplementary information, such as machine (number) or operator, there are many process parameters that determine the results of a process. For instance, the temperature or the cooling time may have a significant impact on the output of an injection molding process. Analyzing the dependency of quality results on process parameters or ambient conditions such as pressure or humidity (when available) help quality engineers to identify the levers for process improvements. Furthermore, a part will usually not be produced on one machine, but on multiple machines at the same time. qs-STAT also supports quality engineers in determining whether the unexpected measurements results can be traced back to a specific machine based on the data.
Univariate correlation analysis can uncover interdependencies between two different characteristics, such as if characteristic 1 is increasing and characteristic 2 is also increasing. The correlation analysis checks for relationships between the two characteristics, as well as how significant and of what kind they are. Q-DAS qs-STAT offers different filters and selection criteria to detect trends and deviations. The analyses allow users to reach conclusions about significant influences caused by different factors, such as machine, batch, operator, tool, and temperature.
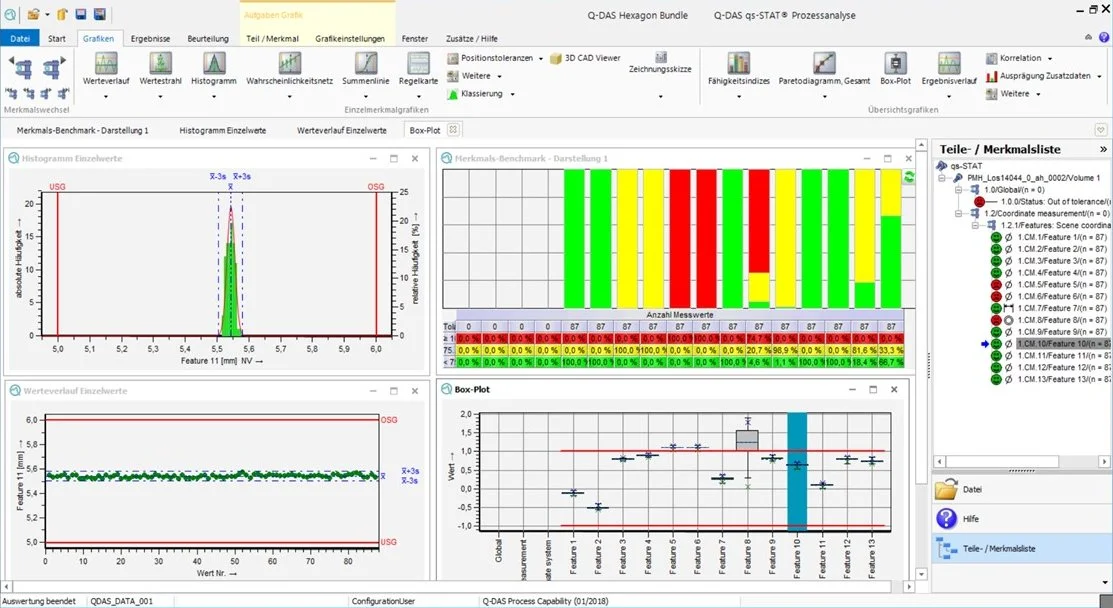
Ongoing requalification to ensure stable processes
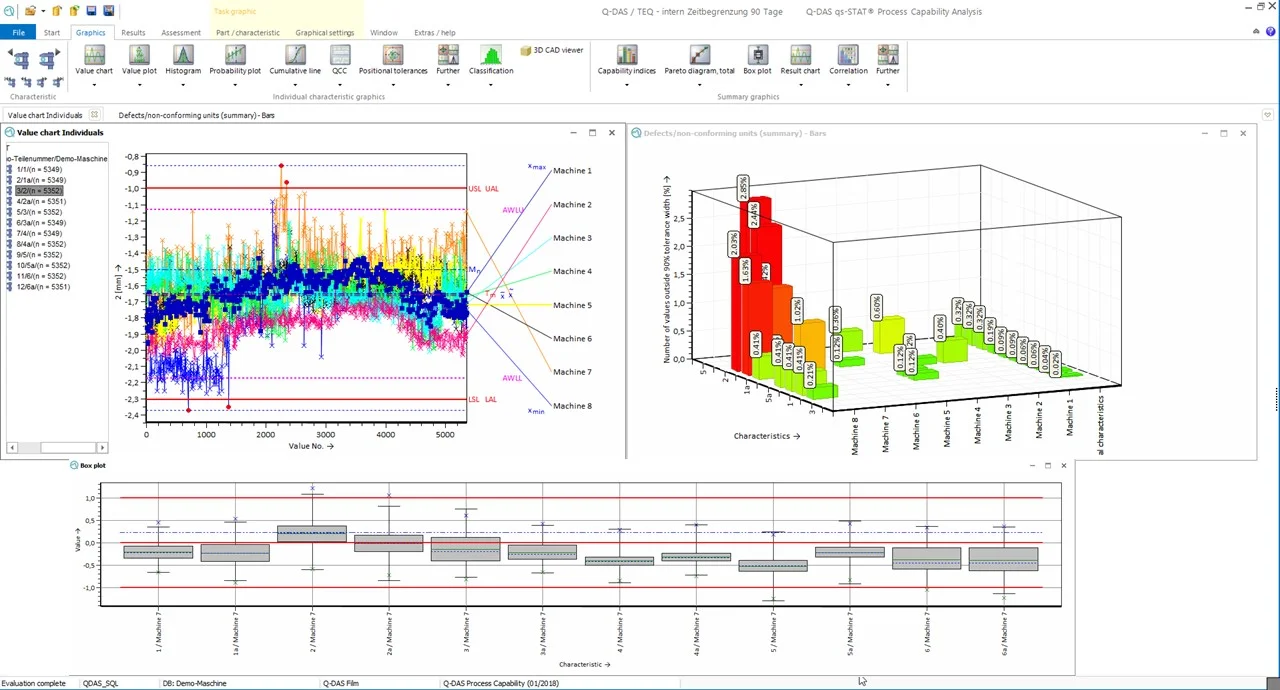
Analysis of machine influence on product quality
Benefits
Using the combination of Volume Graphics software for CT-based quality inspection and qs-STAT from Q-DAS for the statistical qualification and analysis of production processes offers the following advantages:
Trusted Quality Inspection Results
- Accurate GD&T measurements based on:
- accurate determination (“extraction”) of the actual part geometry
- PTB- and NIST-verified fitting of geometry elements to the actual part geometry
- Reliable detection of critical defects (pores, cracks)
- even on lower quality data
- proven in casting and injection molding practice by hundreds of users
- Audit trail for inspection data providing protection against manipulation
Smooth & Automated Workflows
- Semi-automated in the quality lab: automated inspection of multiple CT scans in batches, with subsequent manual import into qs-STAT for process qualification or statistical analyses
- Fully automated on the shop floor: fully automated inspection of CT scans as they are generated, followed by fully automatic data transfer to qs-STAT for statistical analysis
- Industry standard & flexible data exchange format: In addition to VG software, most other metrology equipment supports the well-known and widely used Q-DAS ASCII format for the transfer of quality data so that practically all quality data from existing inspection equipment can be integrated into qs-STAT without adjustments.
Superior Statistical Process Control
- Reliable statistics: Evaluation strategies based on standards, association and corporate guidelines (e.g., BMW, GMPT, Robert Bosch, and Volkswagen), or an individual approach are included and used automatically, making results comparable and reliable.
- Certification & Validation: Because of reliable statistics, users are well prepared for most kinds of quality audits, whether by their customers or by auditing companies.
- Insightful analyses: A wide range of statistical analysis and visualization tools (incl. statistical test procedures, correlation analysis, subgroup statistics, charts of results, and traceability analysis) make it easy to find and validate new insights, e.g., root causes of deviations and trends.
- Scalability: The Q-DAS solution is a scalable solution. It can start with a 1:1 connection of inspection equipment and Q-DAS qs-STAT and be continuously expanded up to a solution across multiple company locations.
Download the Complete White Paper
Learn even more in our complete whitepaper. Request it now by filling out the form.
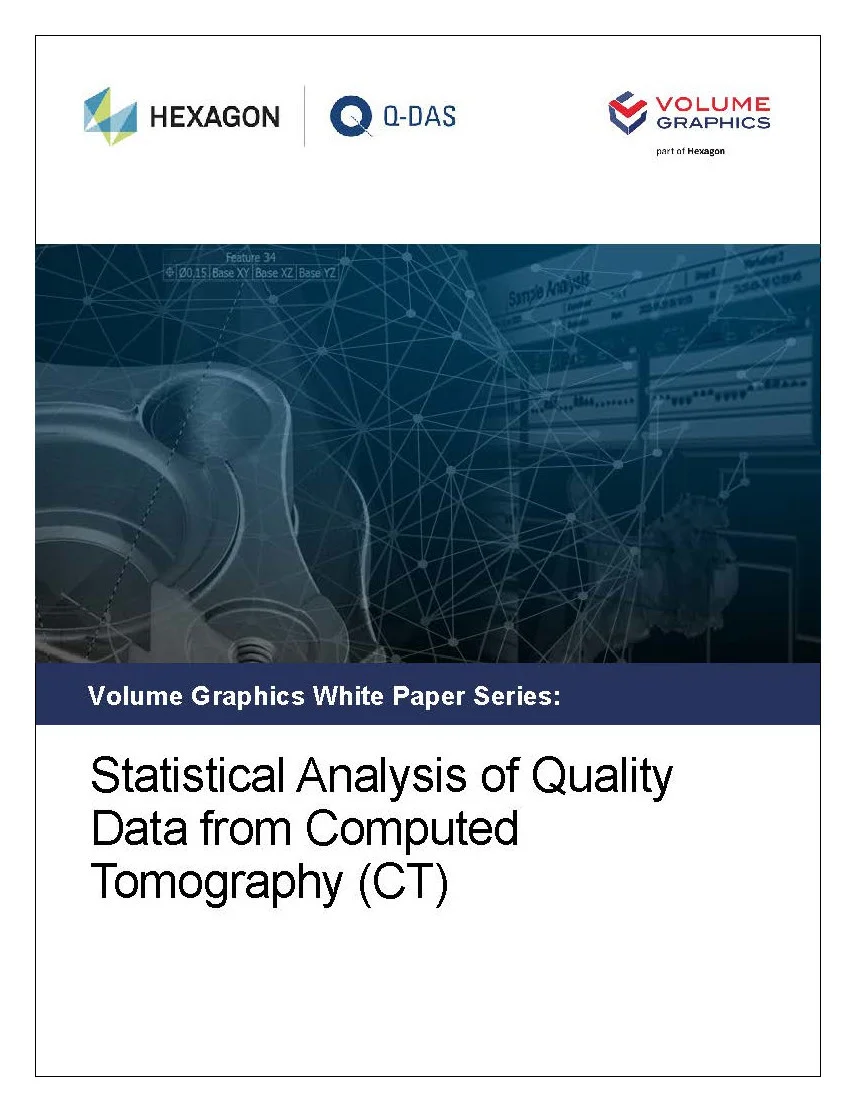
Request the White Paper:
Further Reading
You want to know how Volume Graphics and Q-DAS bring computed tomography and statistics together? Then you should definitely read this article in the German trade magazine GIESSEREI about Q-DAS export in VGSTUDIO MAX and VGinLINE (Giesserei 108 (2021), [No.2], p.40-43).
